
Year-End Report
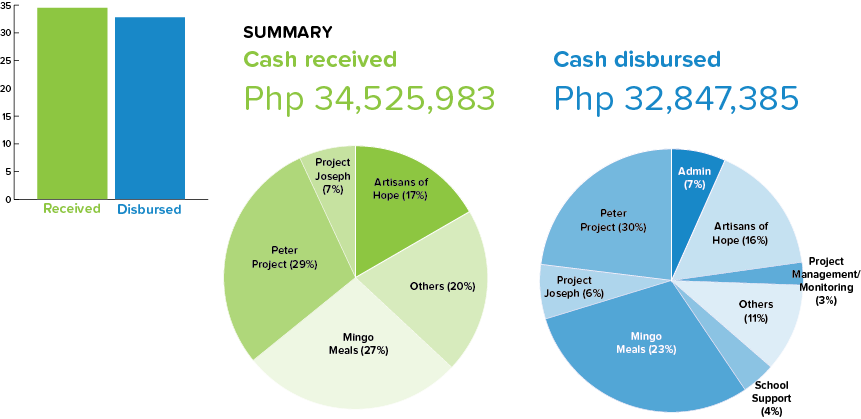
Received by NVC in 2015
| Philippine Pesos (in millions) | % share | |
| Peter Project | 10.030 | 29% |
| Mingo Meals | 9.382 | 27% |
| Other Sources (membership fees, miscellaneous income, donations for relief operations, house construction for beneficiaries, beneficiary community center construction, and other livelihood projects) | 6.991 | 20% |
| Artisans of Hope livelihood project | 5.804 | 17% |
| Project Joseph | 2.318 | 7% |
| Total cash received | 34,525,983 |
How NVC allocated its resources in 2015
| Philippine Pesos (in millions) | % share | |
| Peter Project | 9.762 | 30% |
| Mingo Meals | 7.572 | 23% |
| Artisans of Hope | 5.346 | 16% |
| Other Expenses (including relief operations, house construction for beneficiaries, beneficiary community center construction, and other livelihood projects) | 3.593 | 11% |
| Administrative Expenses | 2.207 | 7% |
| Project Joseph | 2.167 | 6% |
| School Support Project | 1.325 | 4% |
| Project Management & Monitoring | 0.876 | 3% |
| Total resource allocation | 32,847,385 |
Independent Auditors: Alba Romeo & Co., CPAs
Downloads: 2015 Year-End Financial Report (PDF)